Implementation of interactive web map applicable in spatio-temporal data mapping
About Organization
- Name: Louisiana State University AgCenter LaHouse
- Services: Web GIS & Frontend Development
- Website: http://fsh.dev.lsuagcenter.net/
- Principal investigator (PI): Dr. Carol Friedland
Objective
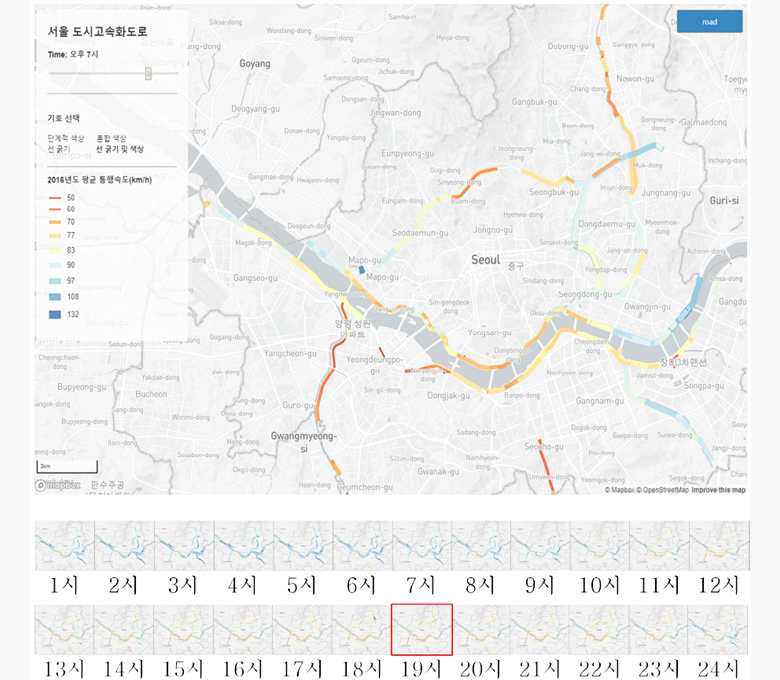
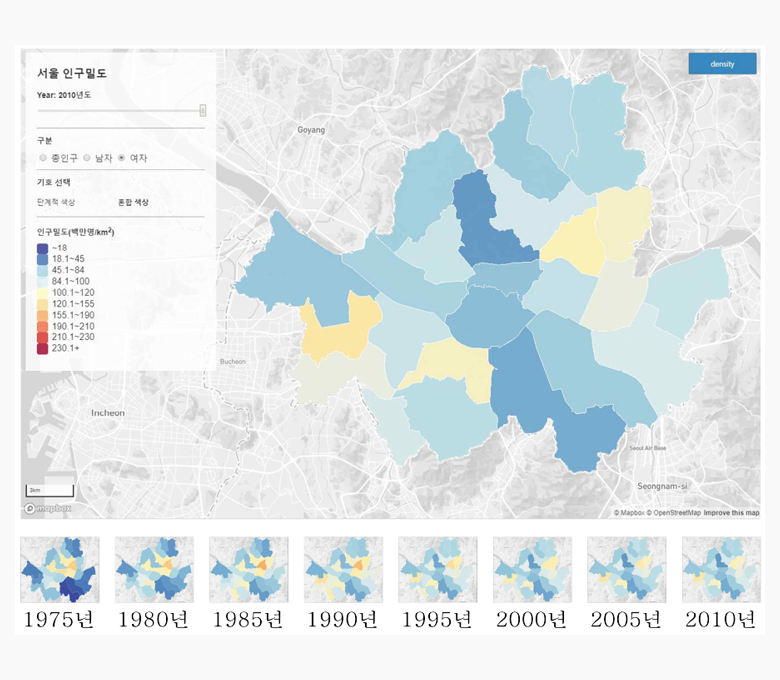
The primary goal of this study is to create an interactive web map using open-source tools such as QGIS and Mapbox GL JS, emphasizing improved spatial information visualization. Through this, I aim to provide users with an intuitive and interactive web mapping experience, enabling them to explore, select symbols, apply filters, reconstruct views, and visualize time series data in line with cartographic design principles.
Tools & Technologies
Map box GL JS, HTML, CSS, JavaScript
Project Details
My Master's thesis at Sungshin Women's University in Seoul, Korea, focused on the development of an interactive web map using open-source tools to improve spatial information visualization and user engagement. The transition from closed, proprietary software to open-source environments accessible to both experts and the general public represents a significant advancement in the field. Specifically, in the Web 2.0 environment, Open APIs have been instrumental in empowering users like me to access our desired information. This transformation has turned web maps into dynamic, interactive platforms that seamlessly integrate various data sources through mashups, allowing me to actively manipulate spatial information through features like filtering and time-series visualization. As web mapping continues to become increasingly prevalent, the adherence to fundamental principles of geographic visualization remains of utmost importance.
In line with this changing environment of web mapping, my research methodology encompassed a review of theoretical concepts related to the web, web maps, and geographic visualization. This served as a foundation for defining the core functionalities of interactive web maps and for selecting Mapbox GL JS as my preferred Map Open API. Subsequently, I implemented vector and raster data visualization through Mapbox GL JS, taking into account cartographic design principles for vector data, and incorporated functions for time series analysis and zooming for raster data.
To summarize, the significance of my project lies in successfully implementing an interactive web map using open-source tools, free from reliance on proprietary software. I've done this while staying true to cartographic design principles to ensure the delivery of accurate geographic information. Beyond covering the fundamental visualization functions of interactive web maps, this study also provides valuable insights into potential avenues for future research.