Flood Safe Home: Version 2
About Organization
- Name: Louisiana State University AgCenter LaHouse
- Principal investigator (PI): Dr. Carol Friedland
- My role: Graduate Research Assistant
- My works: Web GIS & Frontend Development & Frontend Design
- Website: http://fsh.dev.lsuagcenter.net/
Objective
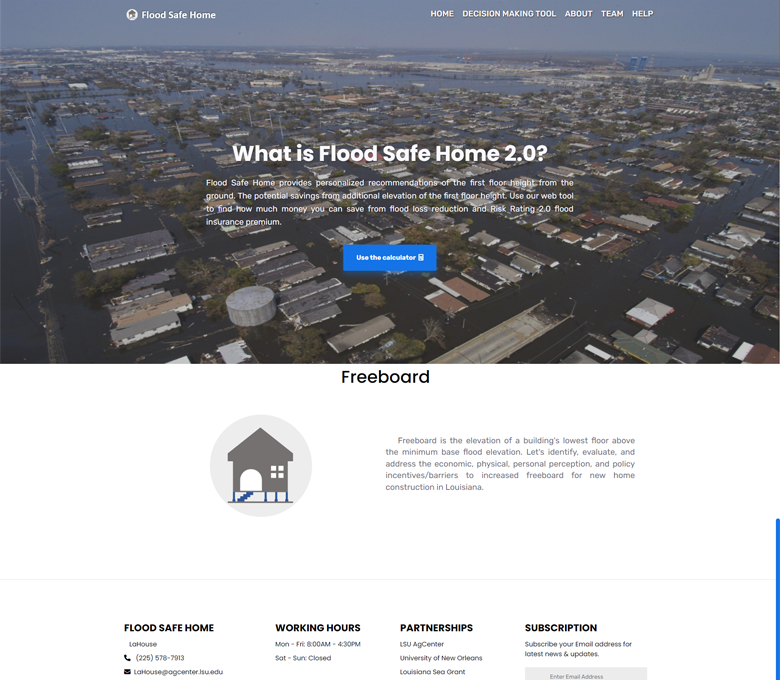
Flood events are a significant concern in various regions, including Louisiana, which is prone to frequent flooding. Elevating homes is an effective strategy for flood protection. However, there are currently no statewide regulations for first-floor height. To address this challenge, this project introduces "FloodSafeHome," a web-based geospatial decision support tool designed to help Louisiana residents make well-informed decisions about flood protection. It aims to suggest optimal first-floor heights to safeguard homes from floods, provide cost-effective flood mitigation solutions, and enhance flood resilience across coastal Louisiana residents.
Tools & Technologies
ArcGIS Javascript, HTML, CSS, JavaScript, React.js, AdobeXD
Project Details
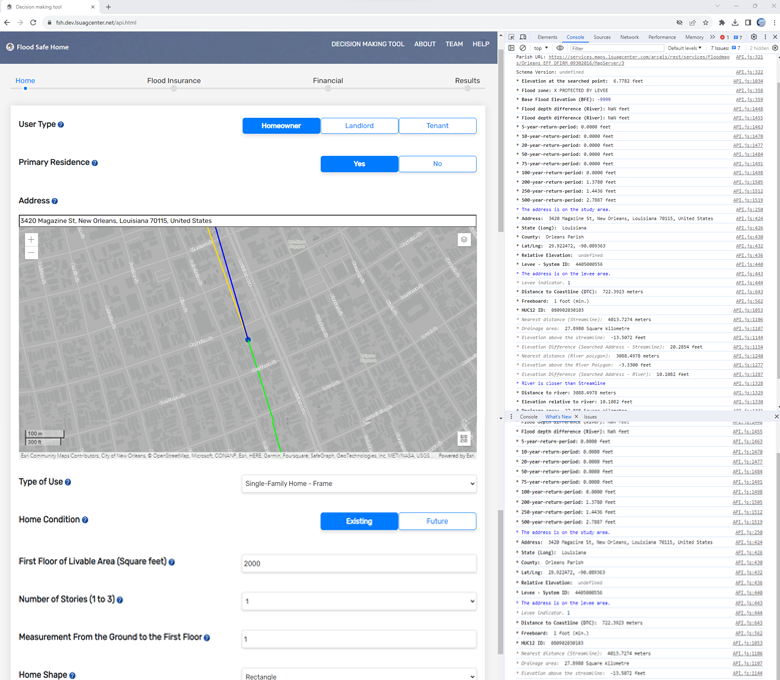
FloodSafeHome is built as a web-based platform with three key components: WebGIS, Front-end Development, and Back-end Development. It leverages technologies like ArcGIS, Bing Maps API, Django, Python, and ReactJS. The back-end handles data management, flood-related calculations, and the development of robust Application Programming Interfaces (APIs). I contributed to creating mockup pages and played a key role in WebGIS development, which involved systematically gathering geospatial data from various sources for calculations. The front-end, another aspect of my involvement, is responsible for collecting user data and displaying cost analysis reports. The tool is deployed in a cloud environment using Azure.
This collaborative effort resulted in the development of FloodSafeHome, a powerful geospatial decision support tool that assists residents and decision-makers in Louisiana with well-informed decisions regarding flood protection and mitigation.
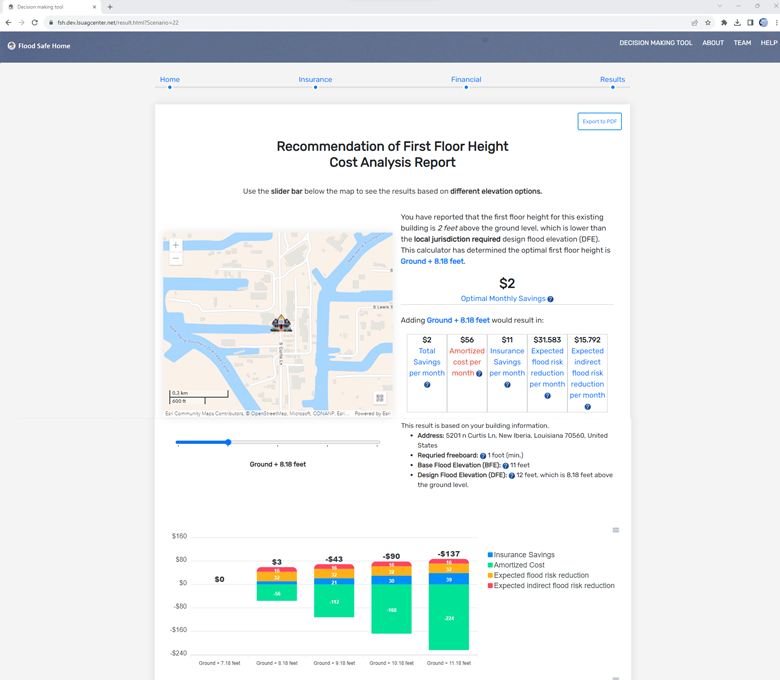
Users input data about their homes, flood insurance, and financial details through a multi-step form. The tool calculates optimal freeboard suggestions, flood costs, and savings based on the provided information. The results page offers a detailed cost analysis report and allows users to explore different scenarios, adjusting first-floor heights. Charts are generated using Apexcharts.js, and users can save them as images or Excel files. Additionally, a report in PDF format provides detailed information on the calculated results.